Capturing Stats by time
With Oracle GoldenGate there are times when you want to know the number of DML that is being pushed through the system. Oracle provides this through the STATS command from within AdminClient (new GGSCI); but what if you want to capture this information on the fly while processing is happening. How would you accomplish this?
In this post, I’ll outline what I did for a customer to help them achieve this use-case and provide some feedback. The items used are completely customizable and can be used for any environment.
As I started to break down this use-case, I wanted to do something that wasn’t tied directly to the replicat process, but would get the information as it was flowing in and then place it into a table called HIST_STATS. The goal was to capture the amount of DML coming in on a timed basis. The table HIST_STATS is setup as follows:
create table tpc1.hist_stats
(
table_name varchar2(30),
op_date timestamp,
inserts number,
updates number,
deletes number,
truncates number,
primary key (table_name, op_date)
);
Notice that the table is in the TPC1 schema, but in reality it can be in any schema that Oracle GoldenGate has access to. I just choose to put it the same schema as the target tables. At the same time, the PK is set to be table_name and operations date (op_date). This is to ensure that I get all the tables at least once and order the stats by date when they come in. Outside of the PK, I’m just capturing the standard DML (inserts, updates, deletes, and truncates). Keep in mind that truncates really are DDL within Oracle GoldenGate; expectation is that this column should always be zero (0) unless DDL is enabled.
With the table set, now I need to configure Oracle GoldenGate to apply this information from the trail file that the replicat reads. The easiest way of doing this is to use the header information in the trail file. I have written a previous blog post on this over on dbasolved.com, check it out. In order to read this information and place it into the HIST_STATS table, the approach I took was to use a macro. The macro that I defined was the following:
MACRO #stats_handler
PARAMS(#user)
BEGIN
, TARGET #user.hist_stats
, COLMAP ( table_name = @GETENV ('GGHEADER', 'TABLENAME')
, op_date = @DATE ('YYYYMMDD HH:MI:SS', 'JTS', @GETENV('JULIANTIMESTAMP'))
, inserts = @GETENV ('STATS', 'TABLE', '#user.*','INSERT')
, updates = @GETENV ('STATS', 'TABLE', '#user.*','UPDATE')
, deletes = @GETENV ('STATS', 'TABLE', '#user.*','DELETE')
, truncates = @GETENV ('STATS', 'TABLE', '#user.*','TRUNCATE')
)
END;
Macros are great for compartmentalizing logic needed to do things within Oracle GoldenGate. They allow GoldenGate Administrators to simplify and automate work within the replication stream (more information here). I’m not going to spend a lot of time explain this macro, but the general definition of it is that I’m capturing the information I’m looking for out of the trail file header using the @GETENV command and mapping it to the target table of HIST_STATS. One thing to note is that the #user is a variable that is being passed to the macro. This allows for the macro to be used anywhere with any schema (doesn’t hard code the user information). At the same time, getting the date down to the second to make sure data is unique for the stats captured.
With the macro created, it now needs to be mapped directly into the replicat. This is done by using the INCLUDE option, then adding a MAP statement that calls the macro.
replicat REP
useridalias PDBGGATE domain OracleGoldenGate
REPERROR(1403, discard)
REPERROR(1, discard)
INCLUDE ./dirmac/stats.mac
MAP devdb1.tpc.*, #stats_handler(tpc1);
MAP devdb1.tpc.*, TARGET tpc1.*;
When you looking at the parameter file for the replicat, you see that there is a directory called dirmac. This is a customer directory that I use to store the macros. Within Oracle GoldenGate Microservices, which I was using, this directory needs to be created under $DEPLOYMENT_HOME/etc/conf/ogg. This is the default location for parameter files within the Microservices architecture. Once this is created and the macro located there, then the next line is a MAP statement that tells GoldenGate that for every table coming in insert the DML stats by calling the macro. This happens before data is actually applied to the tables in the second MAP statement.
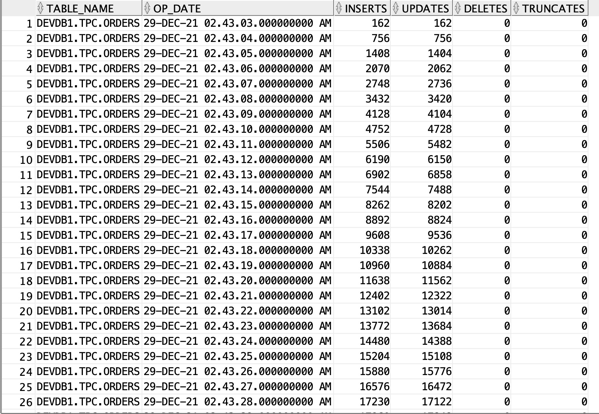
As data is flowing, you will be able to query the HIST_STATS table and validate that data and DML stats are coming in. In the example below, I’m querying the HIST_STATS table to show only a single table:
select * from tpc1.hist_stats
where table_name like ‘%ORDERS’
order by op_date asc;
The results returned are similar to the image:

As you can tell, I can quickly tell the number of cumulative inserts and updates that are happening on the Orders table every second.
There is more that can be done with this to find out the insert/update differences per second, but for the general use-case purposes this shows how it can be done.
Enjoy!!!


